

How to Set EMA Parameters on OKX: A Complete Guide for Crypto Traders

In the fast-paced world of cryptocurrency trading, technical indicators are essential tools for making informed decisions. Among the most popular and versatile indicators is the Exponential Moving Average (EMA). If you're trading on the OKX exchange and want to harness the power of EMAs, understanding how to set and customize their parameters is crucial. This comprehensive guide will walk you through everything you need to know about configuring EMA settings on OKX, from basic setups to advanced strategies for spotting trends and potential entry points in Bitcoin, Ethereum, and other digital assets.
What is the EMA and Why is it Crucial for Crypto Trading?
The Exponential Moving Average (EMA) is a type of moving average that places greater weight and significance on the most recent price data. Unlike the Simple Moving Average (SMA), which treats all price points equally, the EMA reacts more quickly to recent price changes. This makes it an invaluable tool for cryptocurrency traders, as crypto markets are known for their high volatility and rapid price movements. By using EMAs on the OKX trading chart, you can smooth out price action, identify the direction of the trend, and generate potential buy or sell signals, helping you navigate the turbulent waves of the crypto market more effectively.
Step-by-Step: How to Set EMA Parameters on the OKX Trading Interface
Adding and customizing the EMA on OKX is a straightforward process. First, log into your OKX account and navigate to the trading chart for your desired cryptocurrency pair, such as BTC/USDT. Locate the "Indicators" button, usually found at the top of the chart. In the search bar, type "EMA" or "Exponential Moving Average" and select it. The default EMA period (often 9 or 12) will appear on your chart. To modify the parameters, click directly on the EMA line on the chart or find the settings (gear icon) within the indicators menu. Here, you can change the critical "Period" value and customize the line color and thickness for better visual clarity.
Decoding EMA Periods: Choosing the Right Settings for Your Strategy
The most important parameter you will set is the "Period." This number defines how many candlesticks (based on your chosen timeframe) are used to calculate the average. Common EMA settings include the 9-period EMA for short-term trends, the 21-period for medium-term momentum, and the 50 or 200-period EMA for identifying long-term market direction. Many traders use a combination, such as a 9-21 EMA crossover system or a 50-200 EMA "Golden Cross" and "Death Cross" strategy. For day trading crypto on OKX, shorter periods like 9 or 12 on a 15-minute or 1-hour chart are popular. For swing trading, periods like 20 or 50 on a 4-hour or daily chart might be more appropriate.
Advanced EMA Strategies and Parameter Combinations on OKX
To enhance your analysis, consider using multiple EMAs with different periods. A classic setup involves a fast EMA (e.g., period 9) and a slow EMA (e.g., period 21). When the fast EMA crosses above the slow EMA, it can signal a potential bullish trend or buy opportunity. Conversely, when the fast EMA crosses below, it may indicate a bearish shift. Another powerful concept is using the EMA as dynamic support or resistance; in a strong uptrend, the price often bounces off a rising EMA like the 20-period. Traders on OKX also combine EMA signals with other indicators, such as the Relative Strength Index (RSI) or Moving Average Convergence Divergence (MACD), to confirm entries and exits and filter out false signals in volatile altcoin markets.
Common Mistakes to Avoid When Configuring Your EMA
While setting EMA parameters on OKX is simple, several pitfalls can undermine your trading. A common error is using a period that is too short for your trading style, which can generate excessive and unreliable "whipsaw" signals during sideways market conditions. Conversely, an EMA period that is too long may provide signals that are lagging and cause you to enter a trade too late. Avoid relying on a single EMA in isolation; always consider the overall market context, volume, and key support/resistance levels. Furthermore, ensure your EMA settings are aligned with your chart timeframe—parameters that work on a 5-minute chart will not be effective on a weekly chart. Regularly backtesting your chosen EMA parameters on OKX's historical data is key to finding what works best for you.
Optimizing Your OKX Trading Experience with Custom EMA Setups
OKX's robust trading platform allows for significant customization. Once you've found your preferred EMA parameters, you can save your chart template. This means you can instantly apply your customized EMA setup to any new trading pair you analyze, saving you valuable time. Additionally, explore OKX's advanced charting tools to set price alerts based on EMA crossovers or touchpoints. By mastering the setup and application of the Exponential Moving Average, you equip yourself with a foundational technical analysis tool that can help clarify trend direction, improve timing, and ultimately, support more disciplined trading decisions in the dynamic cryptocurrency ecosystem.
“How to Set EMA Parameters on OKX: A Complete Guide for Crypto Traders” 的相关文章
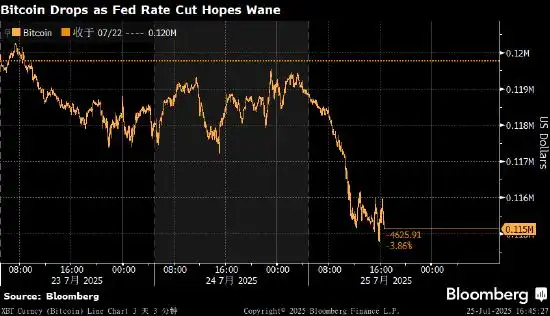
比特币走低 美国降息预期降温影响风险资产需求
全球第一大加密货币比特币价格周五走低,跟随风险资产整体跌势。对美联储降息的预期减弱,导致投资者风险偏好下降。 比特币跌至115,122美元,为7月11日以来最低水平。第二大加密货币以太坊下跌约3%,XRP下挫5.3%。 比特币在上周创下123,205美元的历史新高,驱动价格稳步上涨的因素包括对美...
比特币 (BTC) 兑换新加坡元 (SGD):全面指南与汇率分析
比特币 (BTC) 兑换新加坡元 (SGD):全面指南与汇率分析概述汇率机制兑换平台兑换流程税务影响实用建议比特币兑换新加坡元概述比特币(BTC)与新加坡元(SGD)的兑换是加密货币市场中常见的交易对之一。新加坡作为亚洲金融中心,拥有完善的数字资产监管框架和活跃的加密货币市场,使BTC/SGD交易对...
BTC价格预测:方法与市场因素分析
BTC价格预测:方法与市场因素分析预测方法影响因素预测模型预测准确性实用工具比特币价格预测的主要方法比特币价格预测主要分为三大类方法:技术分析法:基于历史价格和交易量数据常用指标:移动平均线、RSI、MACD、布林带图表形态分析:头肩顶、双底、三角形等基本面分析法:链上数据分析:活跃地址数、哈希率、...
比特币USDT走势图:市场动态与未来趋势分
比特币USDT走势图 | 最新行情分析与趋势预测body { font-family: 'Arial', sans-serif; line-height: 1.6; color: #333; ma...

巴基斯坦的数字“跃进”;年轻人口与能源富余如何推动比特币革命?
巴基斯坦的数字“跃进”:年轻人口与能源富余如何推动比特币革命?标签: 巴基斯坦 比特币 加密货币采用 萨尔瓦多 能源挖矿 数字经济目录:· 序章:古老土地上的新浪潮· 人口红利:年轻巴基斯坦的数字雄心· “快艇”理论:新兴市场的弯道超车· 萨尔瓦多:比特币之路...

驾驭数字时代的财富;一文读懂数字资产的定义、类型与价值
驾驭数字时代的财富:一文读懂数字资产的定义、类型与价值标签: 数字资产 加密货币 区块链 NFT 价值目录:· 序章:从照片到比特币,无处不在的数字价值· 什么是数字资产?· 数字资产的演变与核心特征· 数字资产的多元化类型· 数字资产的重要性与日常...